Validate
Upon completion of the node configuration wizard:
- The node will apply the selected configuration and reboot, followed by a complete measurement-upload scenario.
- The measurement will reach Console and become available for the end user in the UI.
Validation @ Node
The node upon boot will run a pre-defined scenario repeating every awake period, with the main stages summarized in the Table. Each of the main steps included in the scenario can be monitored visually as they are identified by a different color lighting on the RGB led.
| RGB LED Color & Status | Stage |
|---|---|
| Blinking random colors | File system optimization (valid for firmware version v2.11.0+): Runs only after a new configuration is applied. |
| Blinking white | Initialization: Makes the neccessary initialization steps |
| Solid blue | Measurement: Execute measuremenent scenario according to configuration and attached sensors |
| Solid red | Network Connection: Connect to selected network using the configured technology |
| Solid green | Data upload: Send measurement data to Console |
| off | Deep sleep: Go to deep sleep until next cycle |
Validation @ Console
-
Move to the Device page in Console (check platform setup steps if not already loaded).
-
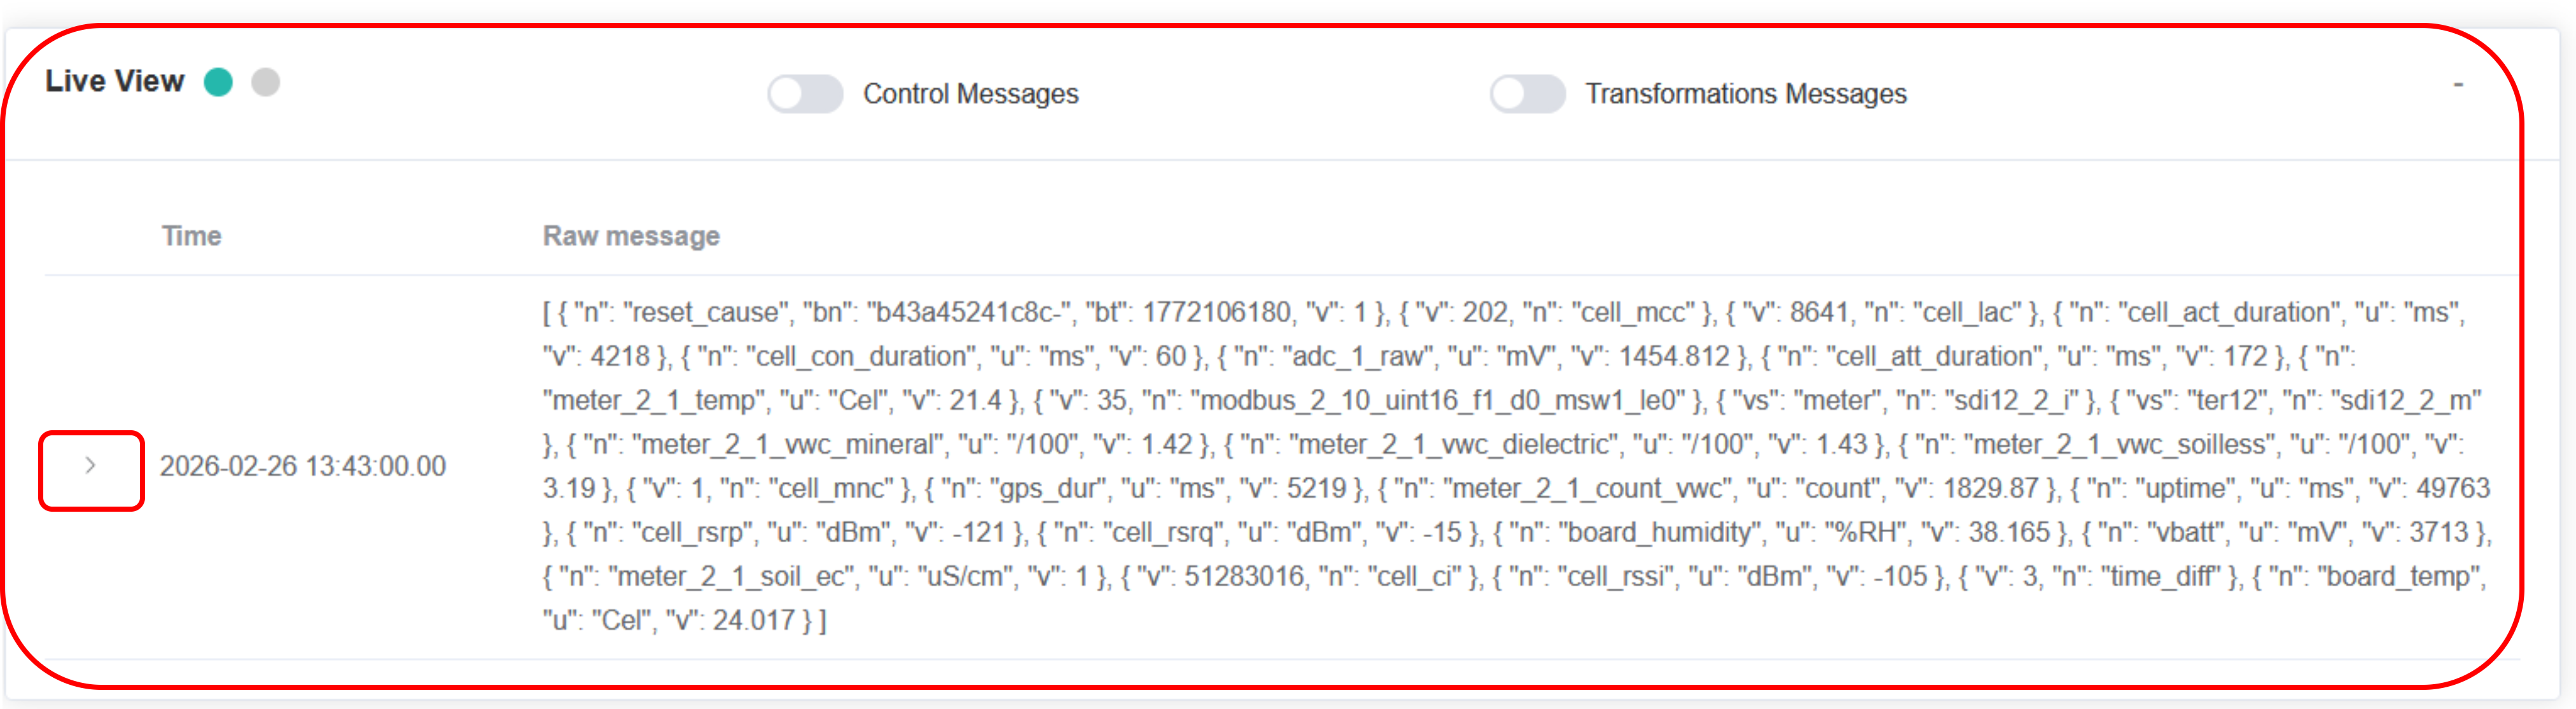
In the Live View panel, the measurement will appear timestamped with its raw data formatted as SenML. A user-friendly representation of the measurement may be viewed by clicking on the > icon next to the timestamp.
-
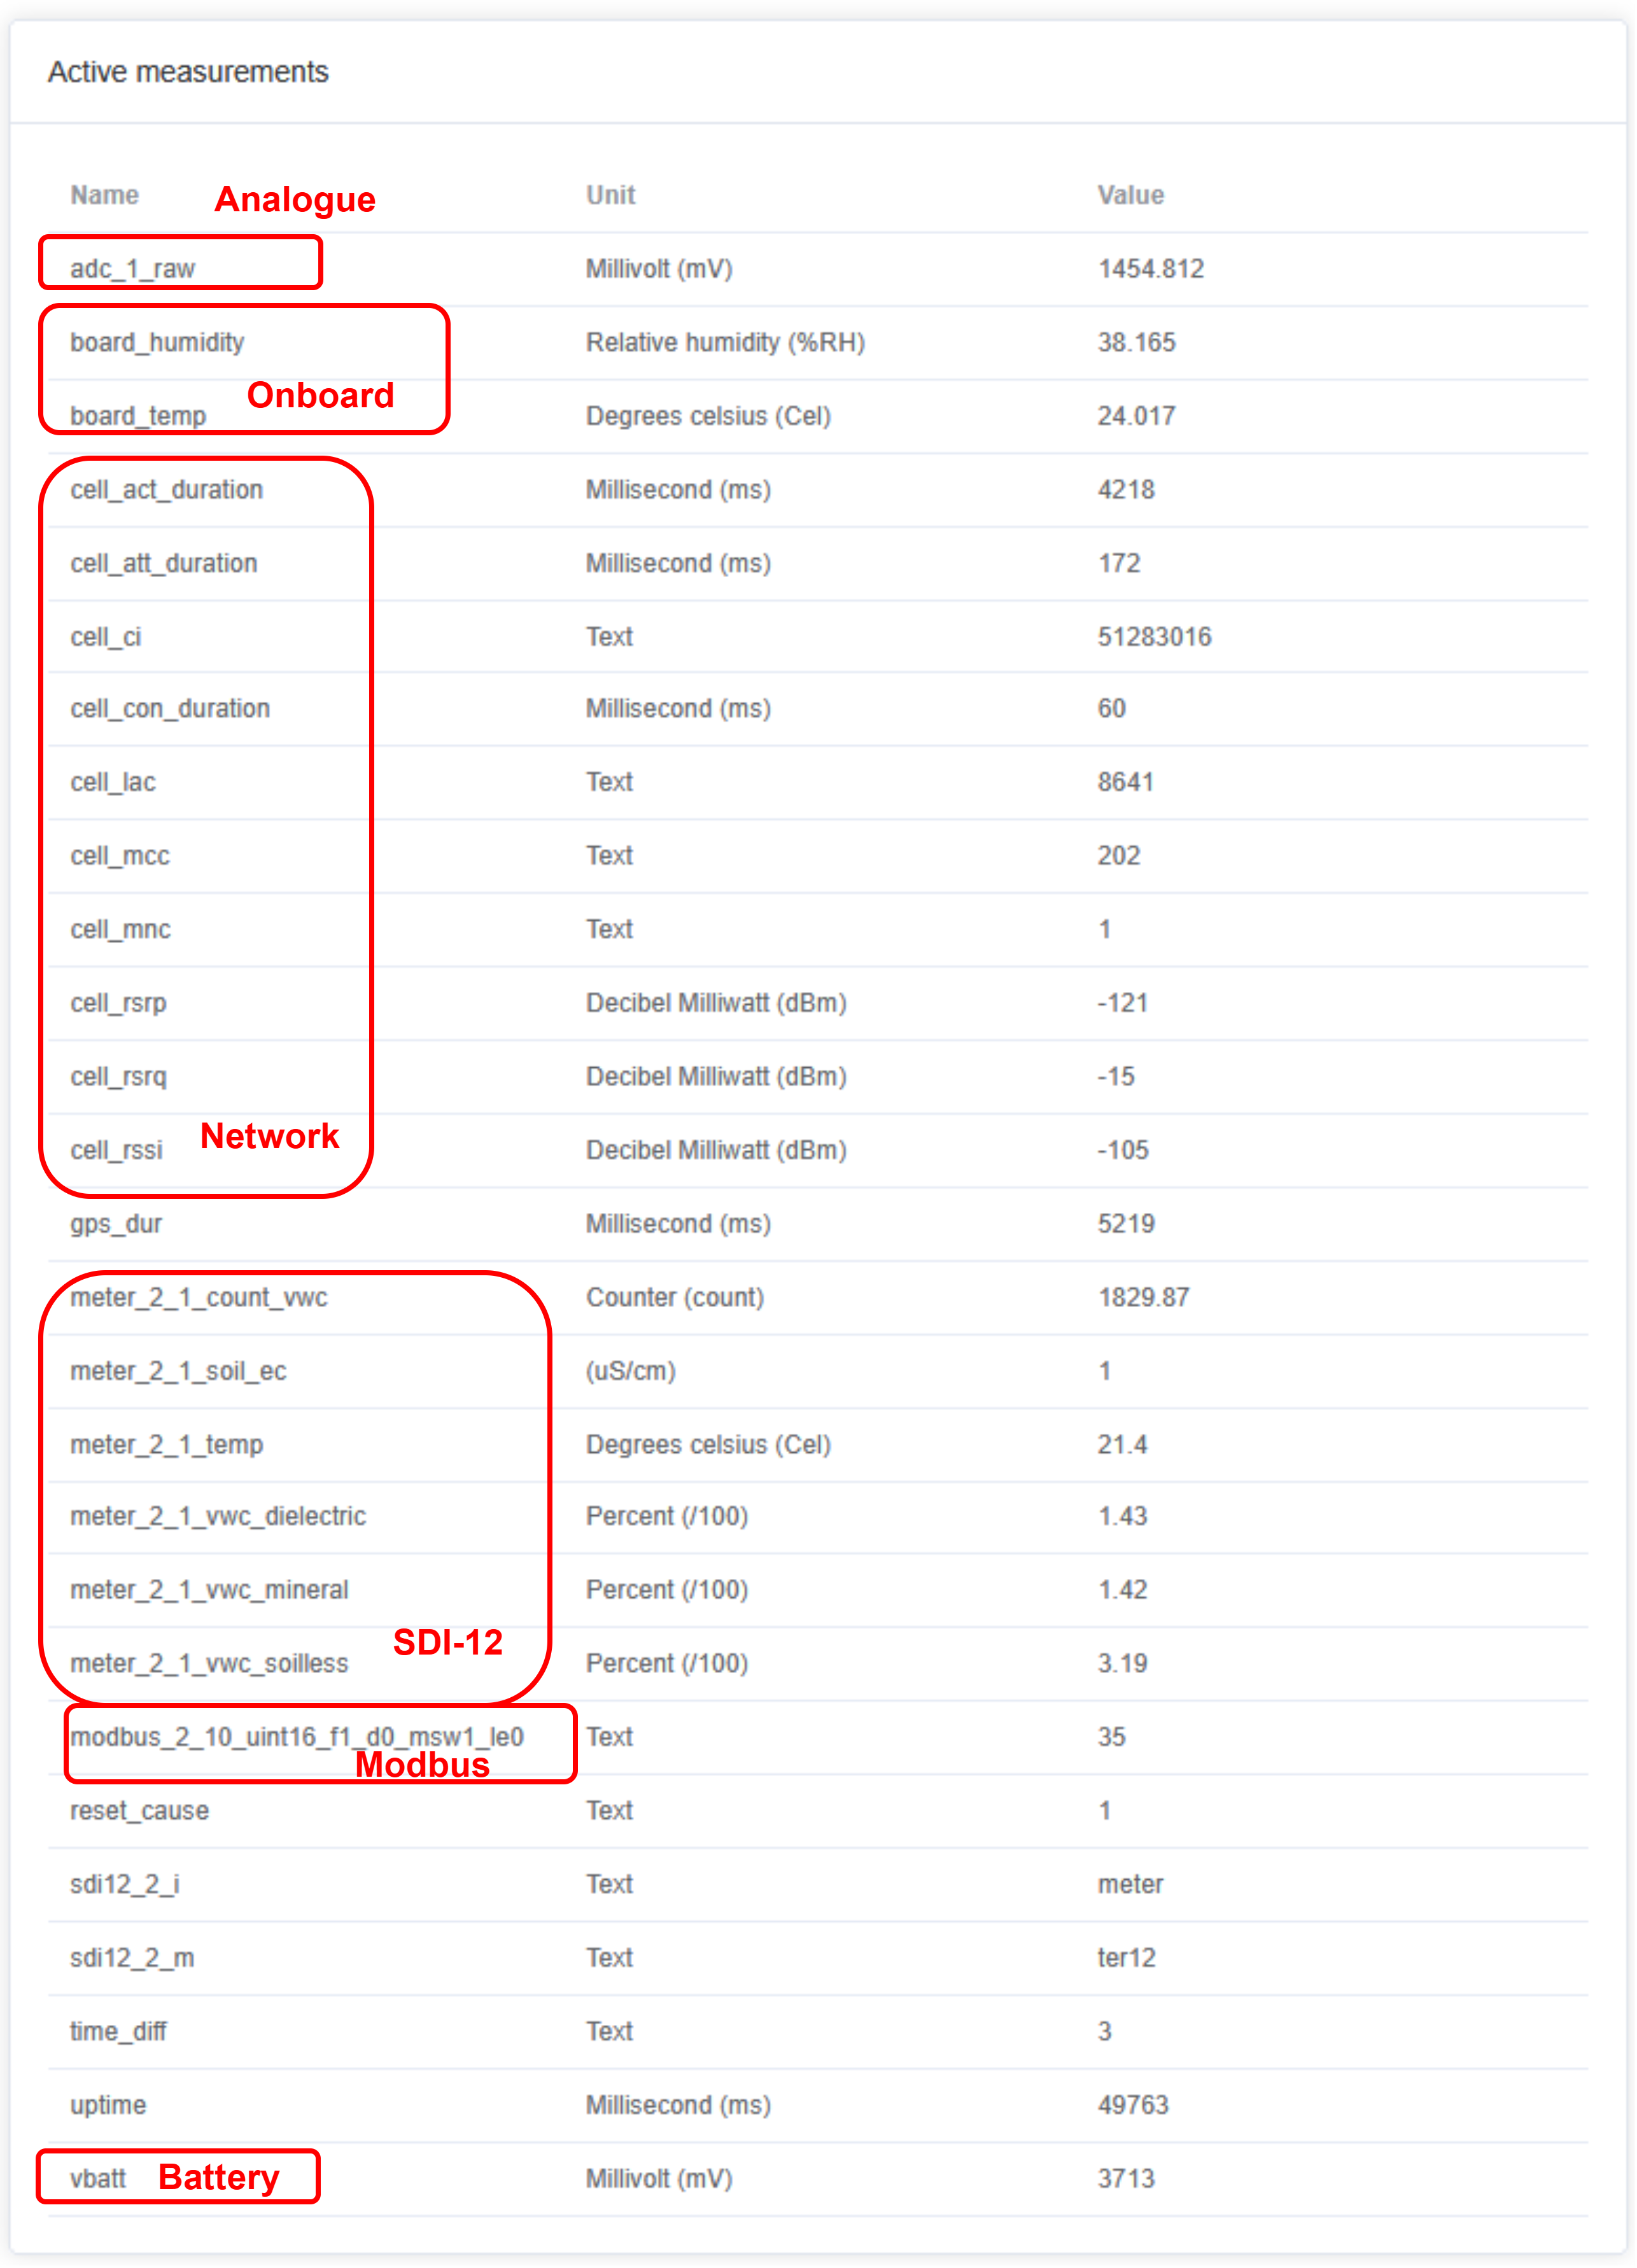
In the Active Measurements panel, the full measurement (most recent) appears expanded. The user may view generic (main board) measurements, shield-specific (sensors) measurements, and metadata, along with thir units captured in the SenML format.
-
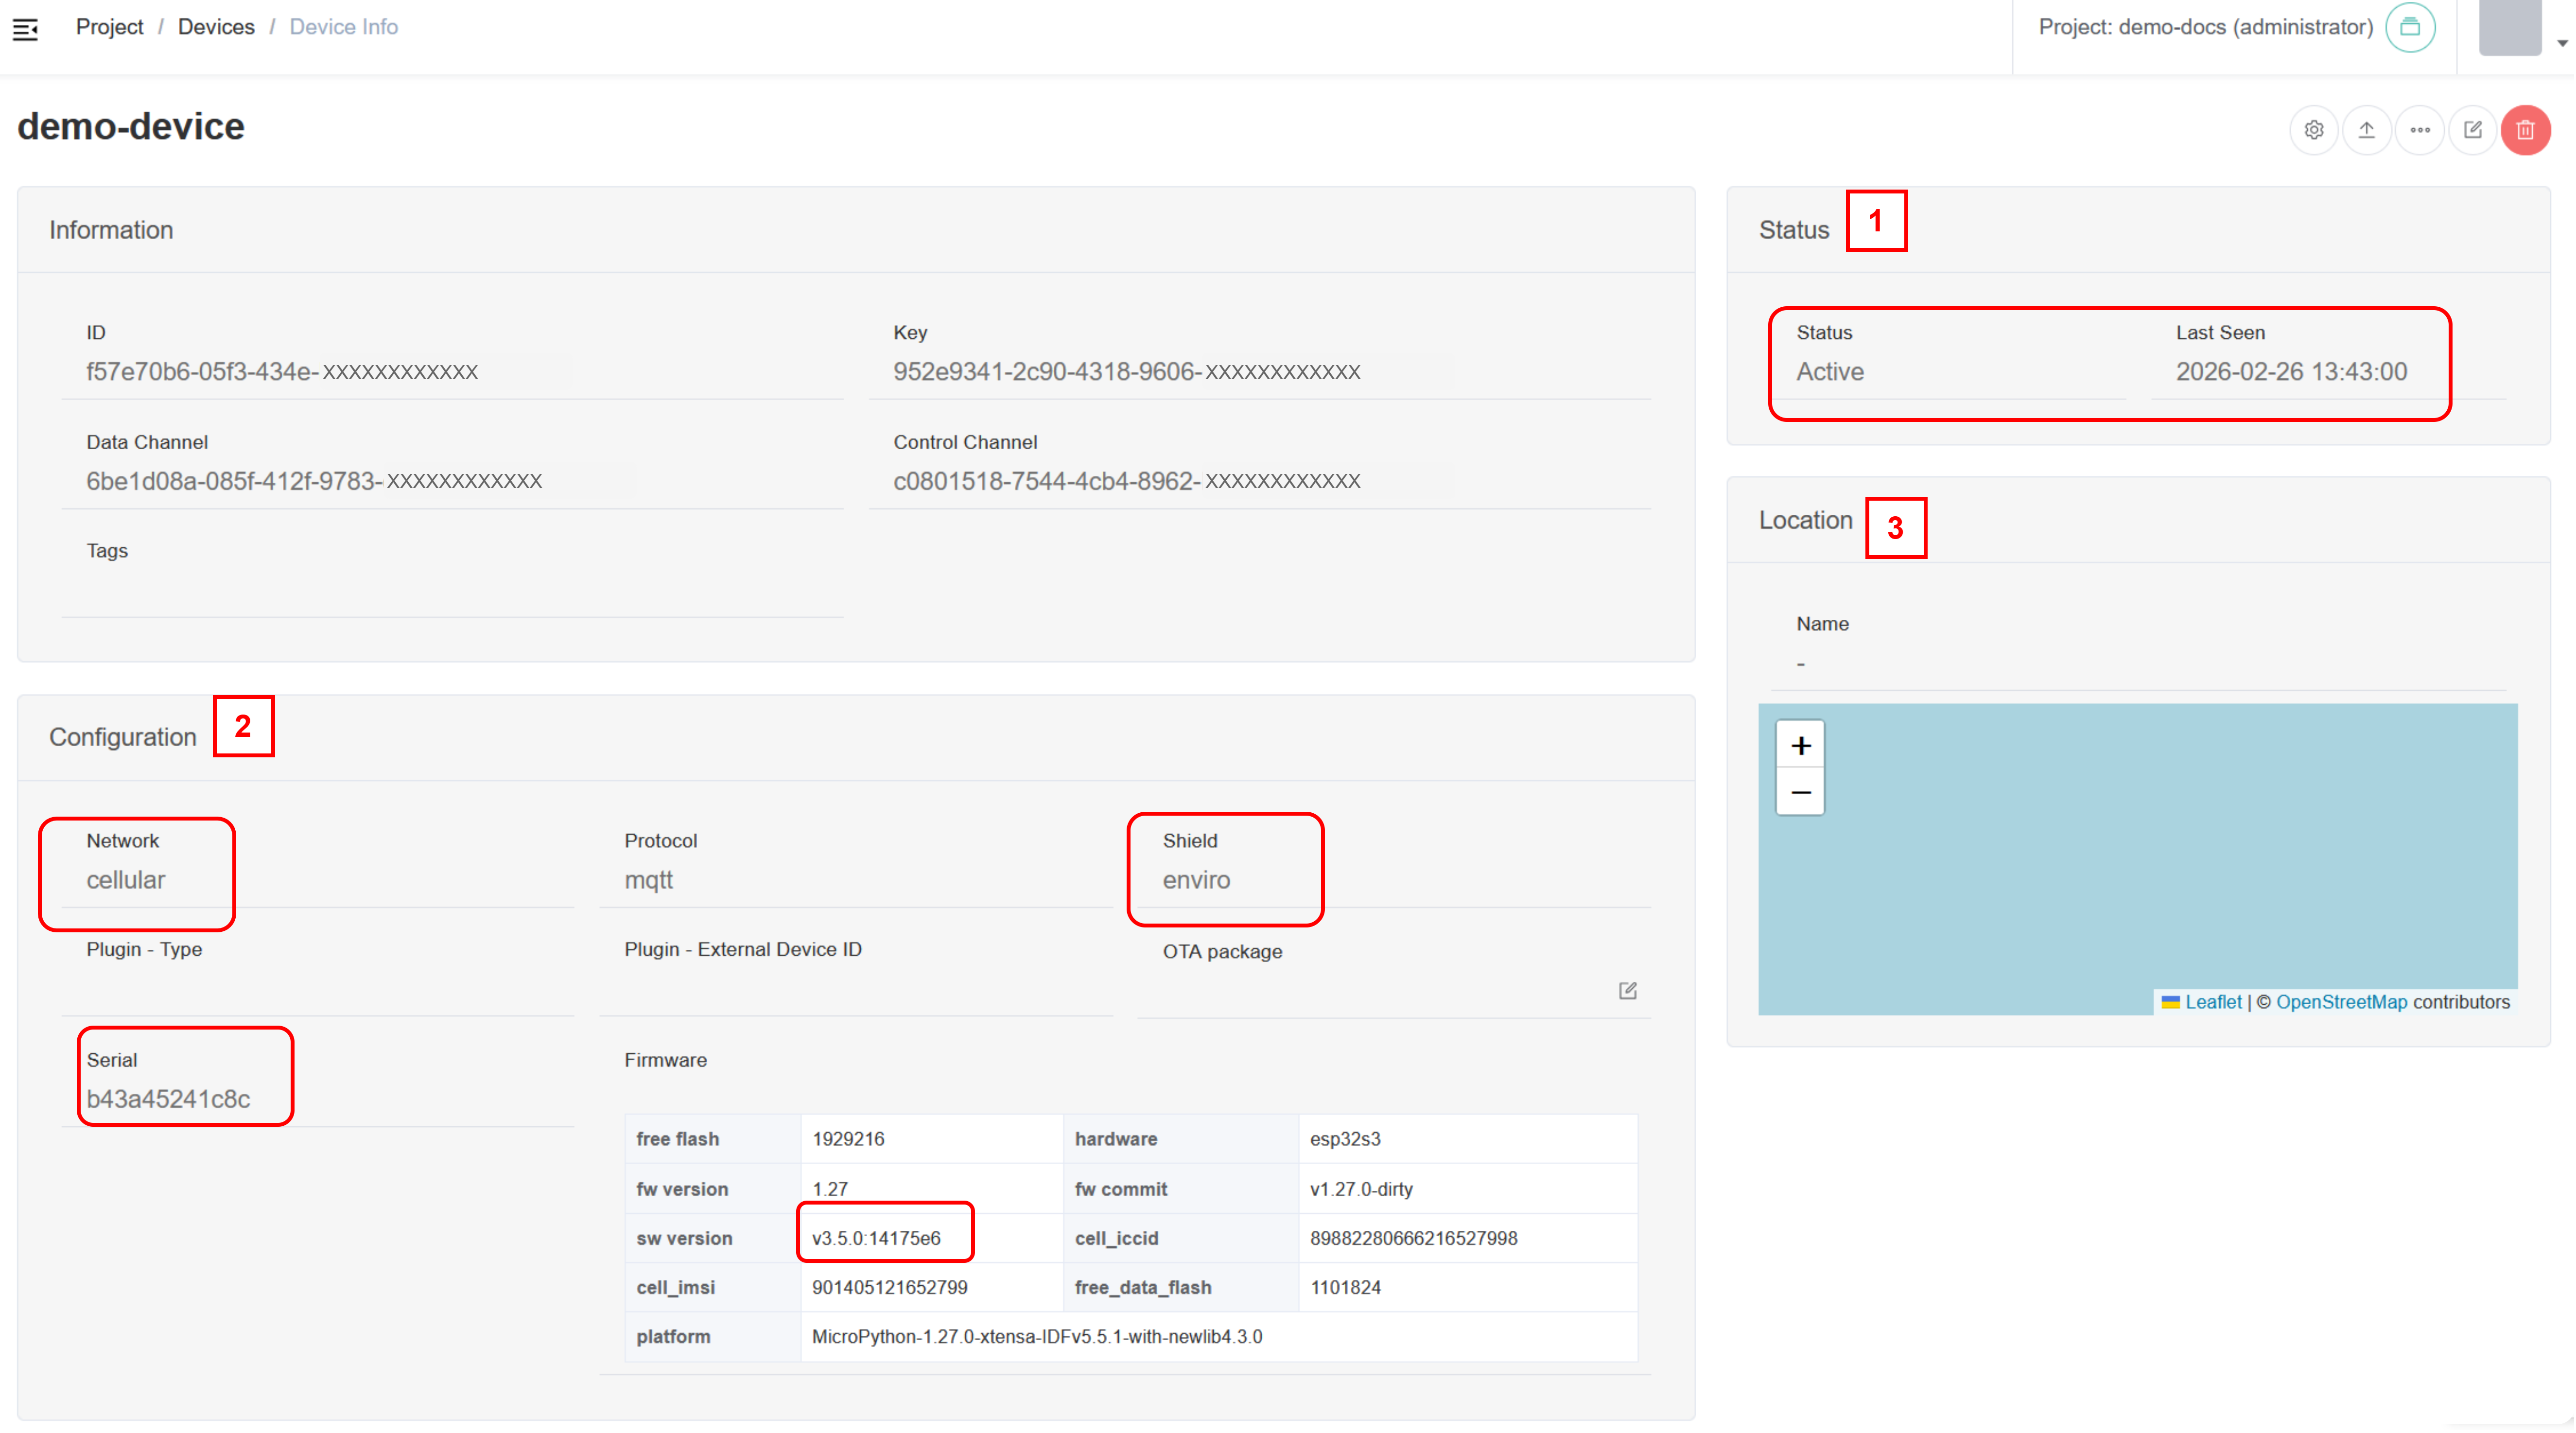
With a page refresh the user may see additional helpful information:
- In the Status panel, the device has been made “Active” as it has communicated with the Console. The last communication is also shown.
- In the Configuration panel, useful configuration information as uploaded by the device is shown, such as: network, shield, serial number and firmware version.
- In the Location panel, an actual map with the location may be shown in case a GPS fix is available or the user has entered the Location manually as described in the Console documentation pages.. This is not shown in this tutorial.
Final Remarks
We have concluded a basic end-to-end configuration & operation example. In the next 3 chapters, the complete documentation of hardware, firmware and platform elements are provided. Have fun!